I didn’t manage to get a July Conundrum in, and nobody had much to say about the June one. I press on with one that educational policy people should really think hard about. (HINT!)
Predict the next value in this sequence: 0, 1, 1, 3, 2, 5, 3, 7, 4, …
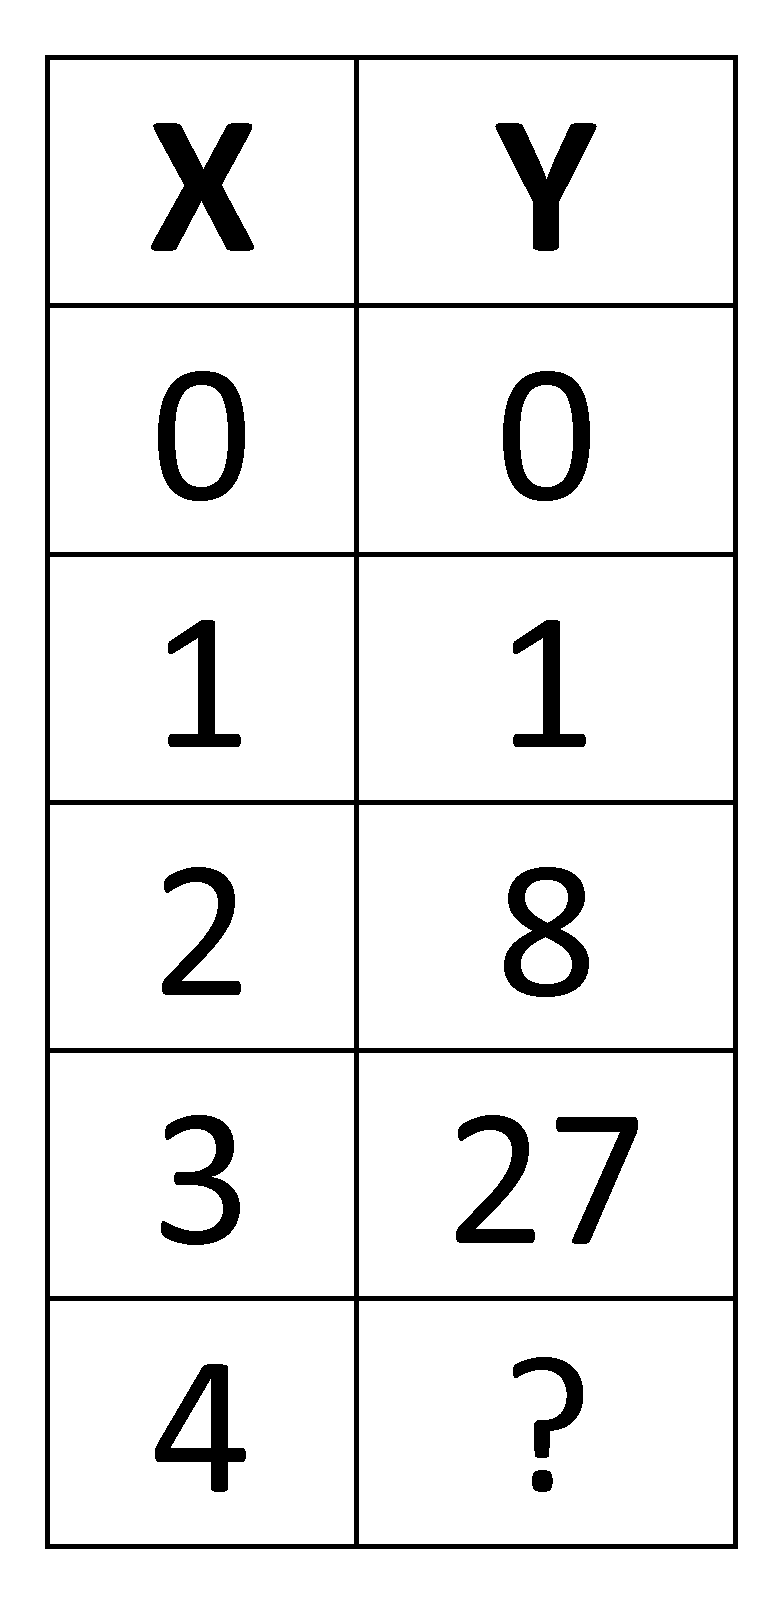
Now, imagine data from an experiment. X is the independent (manipulated) value and Y is the measured (dependent) value. Predict the unmeasured Y, given the data below (i.e., for the X value of 4).
Now for a slightly more interesting activity: In what ways are the two cases different, if any?
Fields of study to think about: scientific realism, aptitude testing.
“Predict the next value in this sequence: 0, 1, 1, 3, 2, 5, 3, 7, 4, …”
The next value is 9.
This is two different lists. The odd entries start at zero increment by one each time (0,1,2,3,4). The even entries start at one and increment by two each time (1,3,5,7). Therefore the tenth value in the list is two more than the eighth, or 7+2=9.
For the chart above, Y is consistently X^3. Therefore I would expect Y = 64 where X = 4.